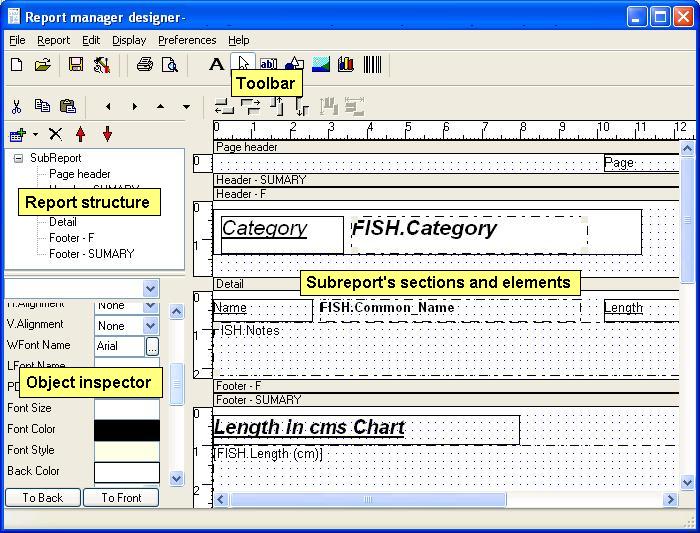
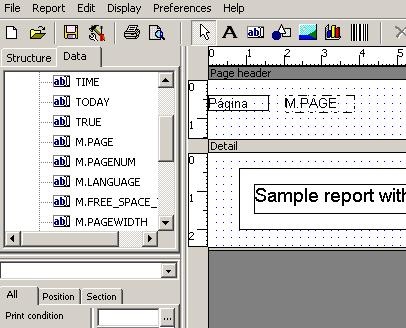
Select new from file menu to create a new report scheme. The design window is divided in four areas.
Report Structure and data
The report structure will determine the way database data is processed, on the second tab, printable variable and database fields are represented on a tree, you can drag and drop to the design area to place elements in the report sections.
Sub report's sections and elements area
This area show the sections and elements for the selected sub report, a report structure can contain multiple sub reports, each sub report have sections, and inside sections there are printable report elements (labels, drawings, images ...).
Object inspector
The object inspector allow editing element properties for any item selected on report structure or sections areas, if you select multiple objects, only the common properties will be available. It allows also to set print order of elements (Z order), using the buttons on the bottom of it. Object inspector show properties in tabs, the first tab show all the properties, the next tabs show properties related to the caption of the tab.
The toolbar
In the toolbar you find basic operations common to other document editing applications (new, preview, cut,copy,paste ...), but a component palette is also available. By default the arrow is selected, this means you can select and drag report items. Component palette is used to place new elements on a section, you select a element from the palette (label, expression, image ..), then draw a rectangle over a section in the sections area, the new report element will be created, and you will see the properties on the object inspector.
Main application of Report Manager is database reporting, but you can execute a report without database access.
Place a label and a rectangle, resize and move them to obtain following report scheme.
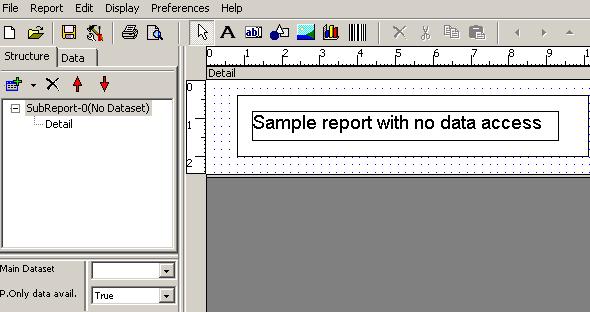
Steps to design the report above:
| Select the label component from component palette | |
| Drag a rectangle over the detail section | 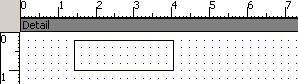 |
| Slide object inspector bar to alter Text property, alter also font size to 14 points | 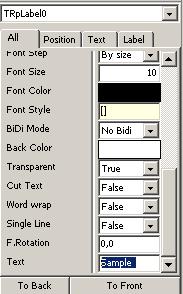 |
| Use corners of label to resize so you see all the text | |
| Select the drawing from component palette | |
| Drag a rectangle, beside the label | 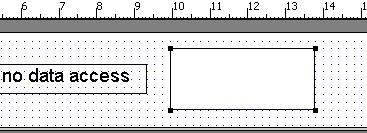 |
| Move the rectangle on top | 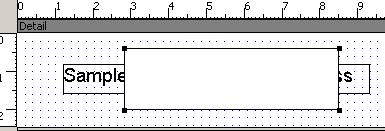 |
| Use bring object inspector buttons to set Z order |
Select the label you placed, and alter some of the properties like font or text. You can select multiple elements by pressing the Shift key,test it and see the common properties for the selected elements are visible in object inspector.
Adding a page header
In the report structure area, click the add button to include a page header.
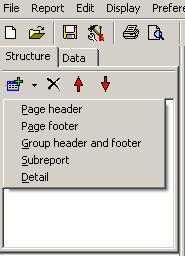
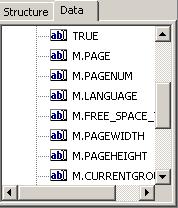
Some basic variables are available to drop in all reports, try adding a page number in the page header. You can access this variables on the data tab, at report structure area.
Adding page numbering
You can modify the size of the sections, by dragging the bar on the bottom or on the right. Remember to save the report, so you can continue the work later.
To execute the report click on the preview icon or select Preview option in File menu.
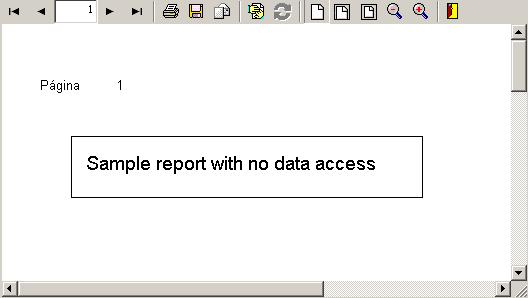
You can click on the buttons to zoom in and out, output to printer or output to other formats. Use the disk icon to export to formats like Adobe PDF.
Experiment changing properties of text elements (alignment, font ...), place other drawings and changing the shape (ellipses, lines ...)
Use command line tool printreptopdf.exe to generate a Adobe Pdf document from the report previously designed. Use printrepxp to preview a report on the screen.
Experiment different options in printrepxp, printereptopdf.
From the report preview save the report to other formats and see the result, test output as text, comma separated values ...