In this chapter we will learn about grouping data, to obtain aggregated values and structure report content.
Let's resume the elements of a report definition file.
| Name | Description |
| Datasets | Datasets are optional but a report usually prints data stored in datasets, the datasets are opened at the beginning of the process, you can open several datasets and establish relations between them |
| Parameters | Parameters are variables that can be printed and can be entered by the end user, you can assign parameters to datasets (parametric querys) |
| Sub report | A Report contains at least one sub report, if it has more than one the engine will process them in natural order. You can assign a dataset to a sub report, if you assign a dataset the engine will print all the detail type sections once for each record in the dataset, else it will print detail sections once |
| Sections | A Sub report contains sections (bands), the most common section type is detail, but other are page headers, page footers and group headers and footers. The engine will print page headers and footers as necessary, it will check group changes, print group headers and footers and print the detail type sections for each record of the dataset assigned to the sub report. A section have useful properties like print condition, align bottom, horizontal displacement etc... |
| Components | Each section can contain components, the components are the really printable items, they are labels, expressions (dataset fields), images, drawings..., this components have properties like Font properties, colour, print condition... |
The engine process sub reports, in natural order, using assigned datasets, printing sections (page headers, footers and details). To print a section means to print all the components contained in it and advance print position by the size of the printed section. Some properties of sections can alter the natural order or the position advance, this allow the insertion of sub reports (child sub reports) or other advanced features.
The default report structure when you create a new report is a detail, remember the detail will be printed once, or, if the parent sub report have a dataset assigned, it will be printed once for each record in the dataset.
You can add a group to the structure, a group will have a header and a footer, there is no limit on the number of groups.
Group behaviour (group break)
The group header will be printed before all the details, the group footer will be printed after all the details (on the active sub report). So, by default the group header is like a report header, and the group footer is like a report summary.
But groups have a special property called Group Expression, the group expression will be evaluated for each record in the dataset of the sub report, if the result changes between records, the footer, and then, the header will be printed again. When a group change happens the group footer is printed with data before the change is done (previous record) and the new header will be printed with the new record data in the dataset.
Sorting the dataset
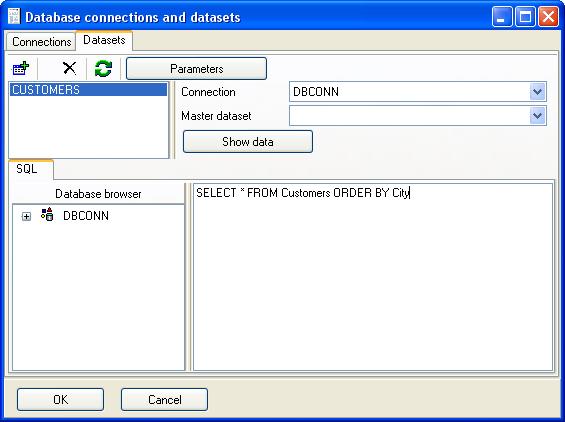
So the trick for data grouping is to sort the dataset correctly. For example, a report design for customers by city, it's mandatory you sort by city:
SELECT * FROM CUSTOMERS ORDER BY City
And then you can add a group and place a at Group expression:
CUSTOMERS.City
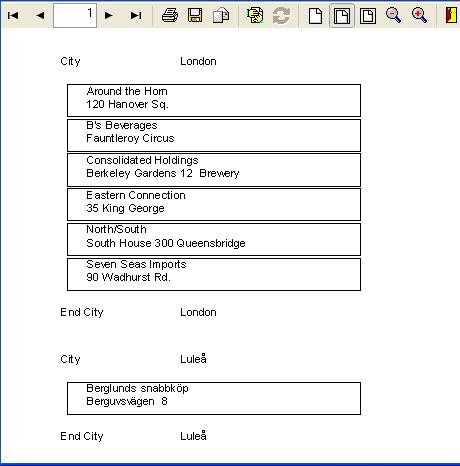
So the report will advance printing customers, but when a customer have a different city, the group will break, the group footer will be printed for the last customer of the city and the header will be printed for the fist customer of the new city.
Now alter the customers report to group them by city.
First the change to the sql sentence
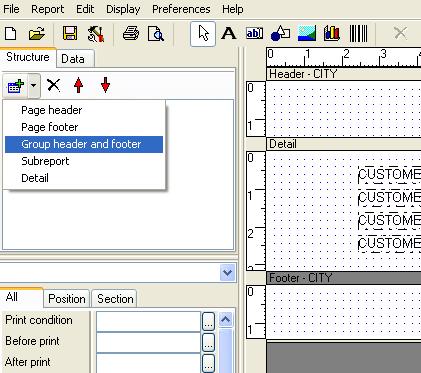
Then add a group to the report structure
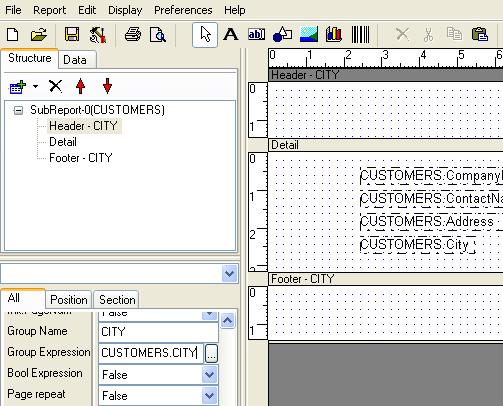
Set the group expression for the group by selecting the group header.
Place labels and expressions on header and footer
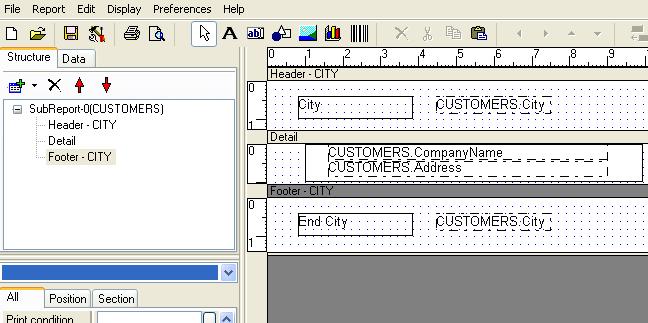
Preview the report
By default expressions are evaluated and the result is printed. You can change the behaviour of a expression to accumulate (aggregate) the expression result and print the aggregated value, usually a sum of values, but other operations are available (min,max,avg,std.desv).
Aggregated expressions will evaluate the initial value expression (usually 0), then will be evaluated again once for each record on the dataset of the sub report, and the specified operation will be done with the previously stored value (usually sum). By default aggregate values are initialised on report start, but you can determine when initialise them, by selecting the aggregate type. For example you can set aggregate type to group and specify the group name, then when the group breaks, the initial value will be set again.
Because aggregate expressions will accumulate the expression for each record, we can use the feature to sum amount for each line of an invoice, but we can also use the aggregates to count records, so we will understand how aggregates work.
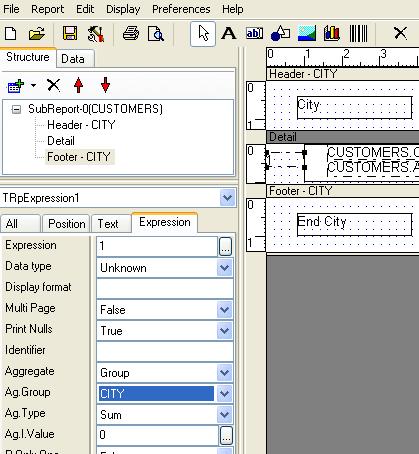
Place a expression element on the detail with a the expression: 1
Set aggregate values to group, and select the newly created group for group name property. For each record in the dataset a 1 will be aggregated. See initial value is 0 by default, when the group breaks, the initial value will be set again.
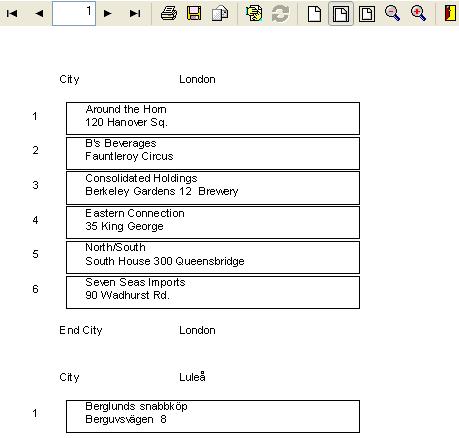
Preview and see how the expression aggregate the value.
You can also place the same expression on the group footer, there, the total count will be printed, so place a label 'Total customers on the city:'
Another example of grouping, showing the detail of sales for each customer. Create a new report and setup a connection and a dataset. Name the dataset as SALES and set sql sentence to:
SELECT D.*,O.* FROM Orders O
LEFT OUTER JOIN "Order Details" D
ON O.OrderID=D.OrderID
ORDER BY O.CustomerId
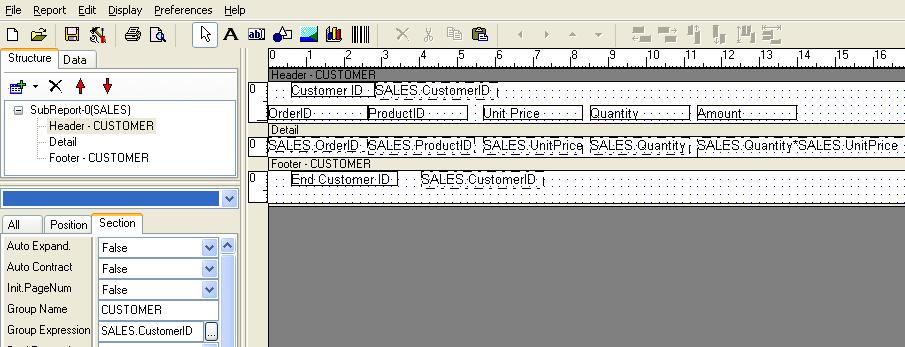
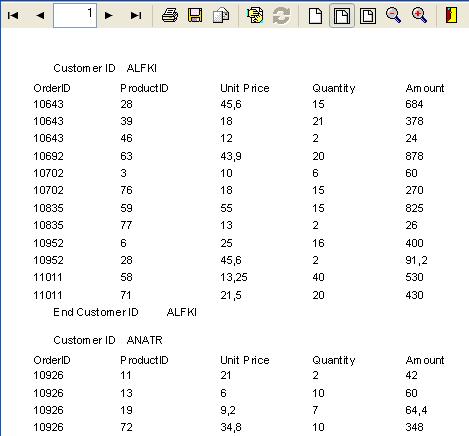
Set Sub report main dataset as SALES. Add a group CUSTOMER with group expression SALES.CustomerID, drop fields OrderId, ProductId, Quantity on the Detail section, also drop a expression element and set expression property to SALES.Quantity*SALES.UnitPrice so it will calculate the amount for that line.
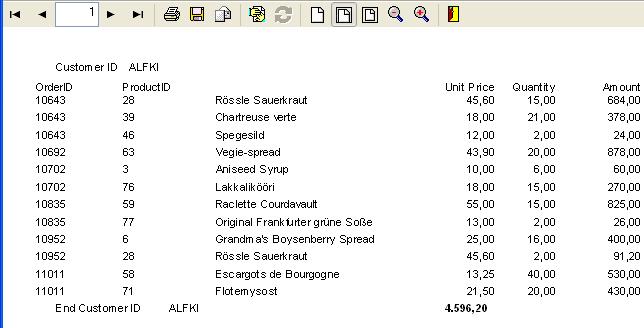
This grouping will result in this preview:
To obtain total sales for each customers you can copy and paste the amount expression to the footer, then set aggregate to group and group name to CUSTOMER. Use a bold font for this amount.
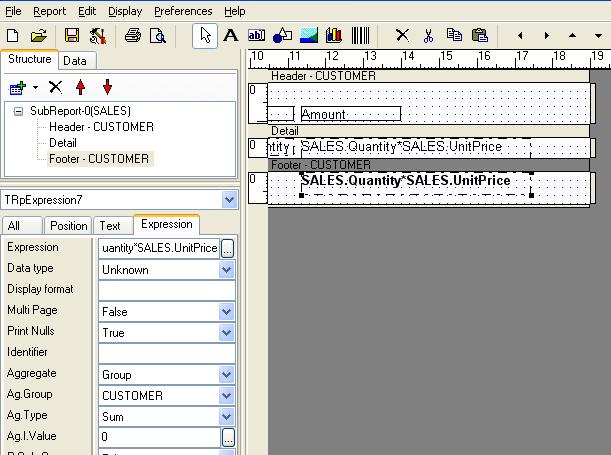
Preview the report to see the aggregate, also align amounts to the right by changing Horz.Alignment property, and display format for numbers as ###,##0.00 so they align decimal places correctly.
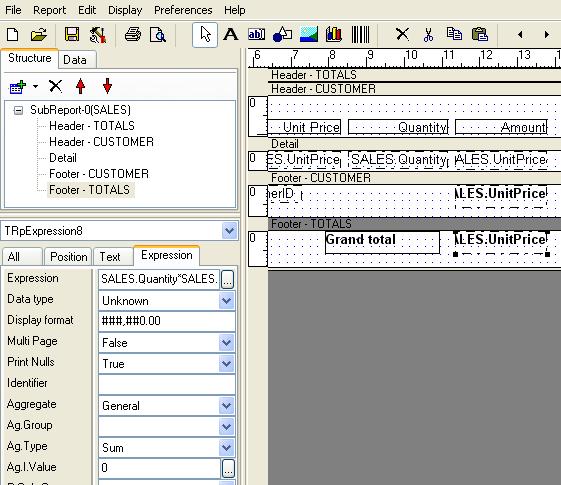
Adding a grand total
Groups usually have a group expression, but if it have no group expression can be used as report header and summary, so add a group named TOTALS. Place the group as the most exterior one, by clicking header on the report structure tree and clicking the up arrow. Resize header height to 0 and place on footer the same expression for the amount value, but this time you must select aggregate to General.
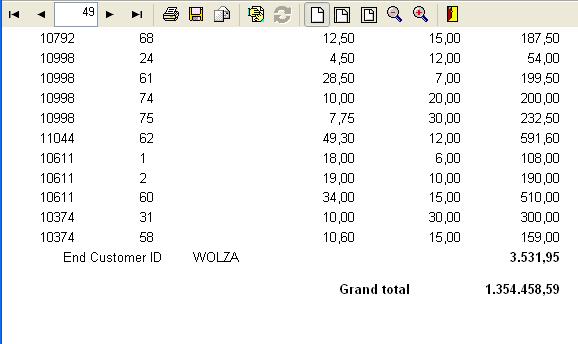
This grand total will appear at the end of the report.
In some cases you must break the group when more than one field changes, for example when customer number or order number changes, then you should use expression evaluator functions to generate a unique expression that will determine group break.
For example if you have a string field Sales.CustomerID and a integer field Sales.OrderId then the expression can be:
FormatStr('00000000',Sales.OrderId)+Sales.CustomerID
So any change to any field will break the group.
On the sales by customer report there is no product name or customer name, a way to obtain them is a join to Customers and Products on the same sql. This is the preferred way. Other less efficient way is execute a query for each record on sales to obtain the product name. This will cause lot of querys to be launched to the database server, the main query will remain simple but for each record the report engine will execute another query. So use linked querys with caution.
The example above will be used to obtain the product name.
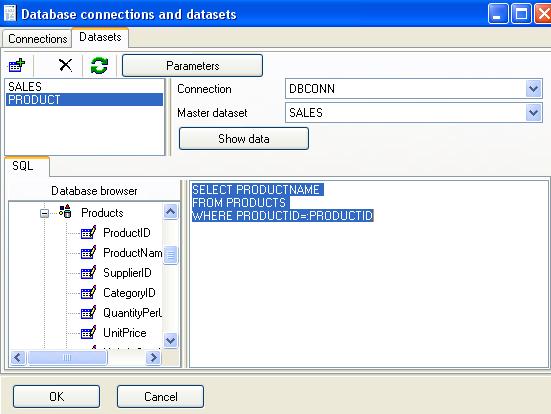
Enter data configuration and add a dataset with the following sql:
SELECT PRODUCTNAME
FROM PRODUCTS
WHERE PRODUCTID=:PRODUCTID
See the double quotes before PRODUCTID, this is a parametric query but we don't define a parameter for it, that is because we set Master Dataset to SALES. The trick is:
If exists a field on Master Dataset with the same name as a parameter on this query, the field on the master dataset will be assigned to the parameter, and if the master field changes, the query will be executed again to reflect changes on the parameter.
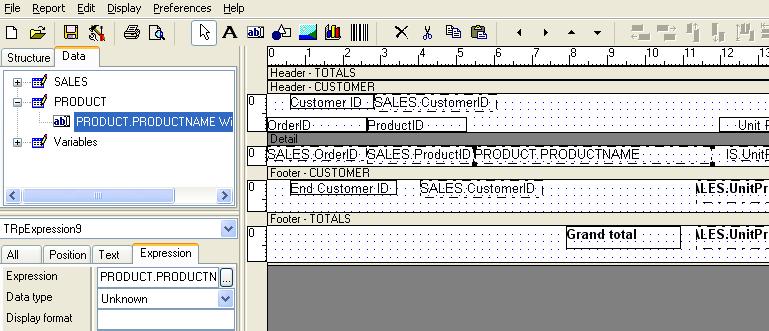
You can drop the new field on the detail.
And preview the report
Modify the report above adding a header and a footer for each invoice
Modify the report above to allow the user to select from a range of Order dates.
Create a new report, grouping sales by date.